Monitoring BigQuery costs in Hashboard with dbt and GitHub Actions
DataOps for an orderly, collaborative data culture
At Hashboard, we write a lot of code, review every change, and deploy releases at (frequent) intervals after running a suite of continuous integration tests. A disciplined culture of DevOps increases our developer productivity, allowing us to ship new features faster while spending less time tracking down regressions.
The core premise of DataOps, or BI as Code, is to bring the same discipline of DevOps into the business intelligence space. That means writing data transformations as code which are checked into a version control system, reviewing changes, and running continuous integration to catch problems early.
At Hashboard, we use dbt to transform our raw data into structured tables through a fully automated data transformation pipeline. We have developed a DataOps workflow that runs, tests, and deploys dbt transformations alongside our Hashboard project. This helps us identify any breaking changes to Hashboard resources and validate our entire data pipeline.
Our dbt models and Hashboard resource configs are stored in the same GitHub repository. To make changes to dbt, we open a new pull request in that repository. Then, a GitHub Action creates a new BigQuery dataset, runs our dbt transformations, and posts a comment on the pull request with a link to a Hashboard preview (assuming everything succeeds!). The entire process takes only a few minutes and provides rapid feedback when issues arise.
A worked example of DataOps at Hashboard
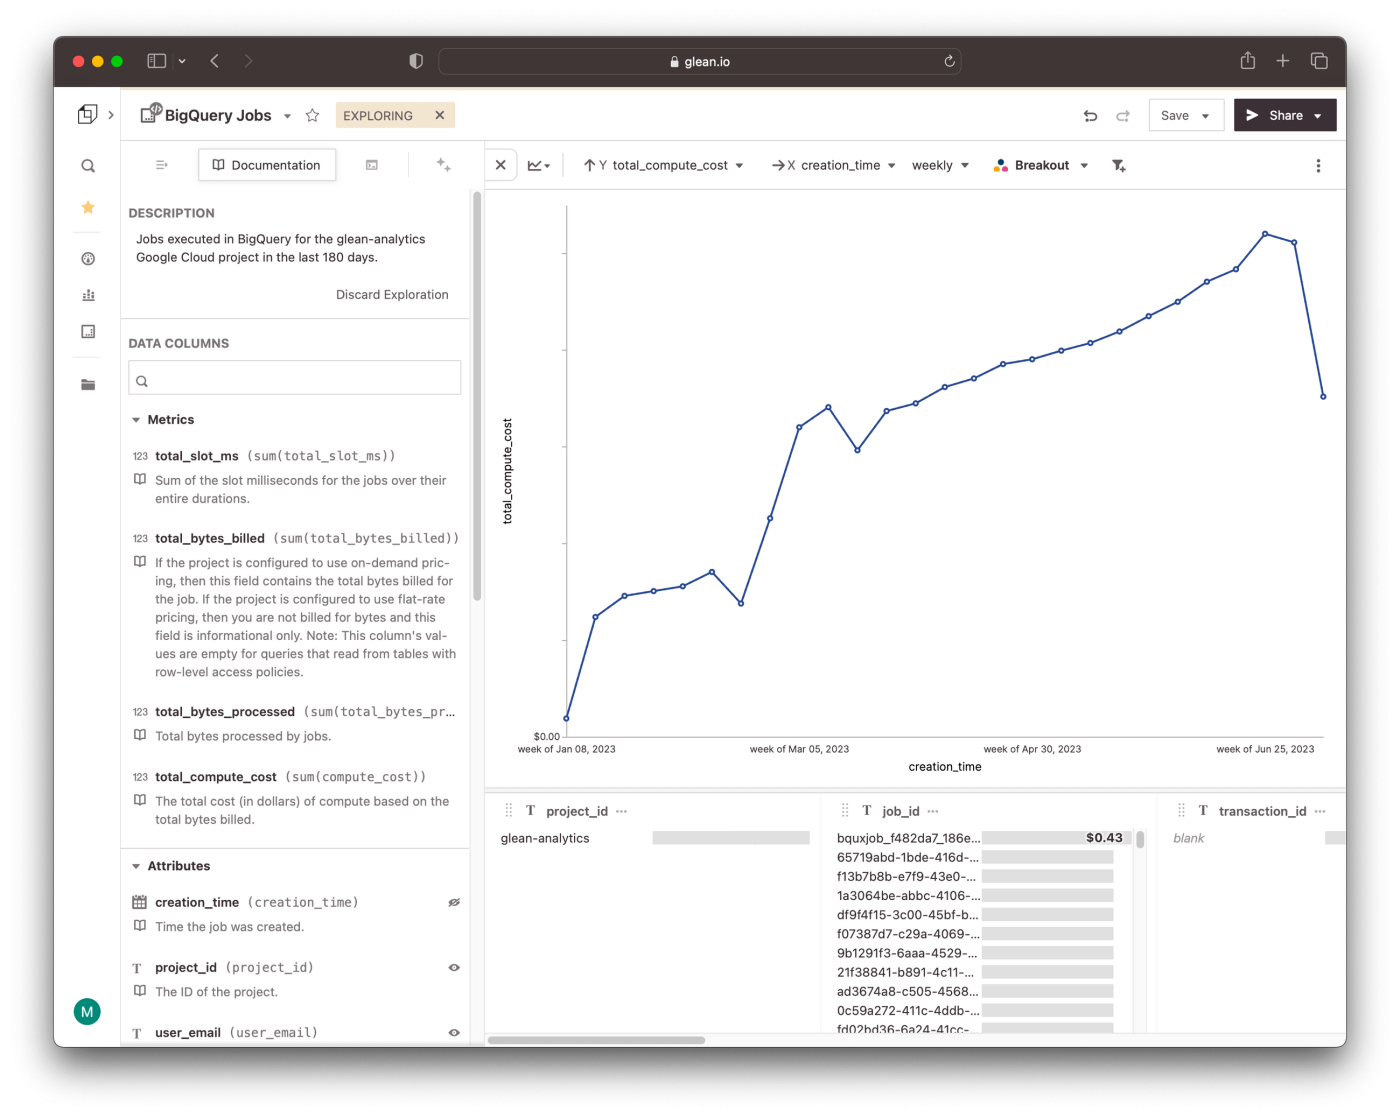
Recently, I noticed that we were spending quite a bit of money on BigQuery jobs in Google Cloud Platform. To dig a bit deeper into the problem and identify usage patterns, it would be useful to analyze the BigQuery jobs our systems are running and estimate their costs. Fortunately, BigQuery makes this data available through a special table called INFORMATION_TABLE.
Creating a new dbt model
I started by creating a new dbt model from the BigQuery table. Here’s what that query looked like:
-- models/gcp/bigquery_jobs.sql

SELECT
    creation_time,
    project_id,
    user_email,
    job_id,
    transaction_id,
    job_type,
    statement_type,
    start_time,
    end_time,
    state,
    total_slot_ms,
    total_bytes_processed,
    total_bytes_billed,
    cache_hit,
    ARRAY(
        SELECT
            project_id || '.' || dataset_id || '.' || table_id
        FROM
            UNNEST(referenced_tables)
    ) AS referenced_tables,
    (error_result is not NULL) as is_error,
    ((total_bytes_billed / POW(10, 12)) * 6.25) as compute_cost
FROM
    `region-us`.INFORMATION_SCHEMA.JOBS
I calculated the cost of a job by multiplying the terabytes billed by the GCP listed price-per-TiB, which at the time of writing is $6.25.
# models/gcp/schema.yml

version: 2

models:
  - name: bigquery_jobs
    meta:
      hashboard:
        hbVersion: "1.0"
        name: BigQuery Jobs
        description: Jobs executed in BigQuery for the hashboard-analytics Google Cloud project in the last 180 days.

        # Hashboard metrics we want to add to our model
        cols:
          - id: total_slot_ms
            name: total_slot_ms
            type: metric
            aggregate: sum
            physicalName: total_slot_ms
            description: Sum of the slot milliseconds for the jobs over their entire durations.

          - id: total_bytes_billed
            name: total_bytes_billed
            type: metric
            aggregate: sum
            physicalName: total_bytes_billed
            description: |
              If the project is configured to use on-demand pricing, then this field contains the total bytes billed for the job. If the project is configured to use flat-rate pricing, then you are not billed for bytes and this field is informational only.

              Note: This column's values are empty for queries that read from tables with row-level access policies.

          - id: total_bytes_processed
            name: total_bytes_processed
            type: metric
            aggregate: sum
            physicalName: total_bytes_processed
            description: Total bytes processed by jobs.

          - id: total_compute_cost
            name: total_compute_cost
            type: metric
            aggregate: sum
            physicalName: compute_cost
            formattingOptions: { formatAsDollars: true, fixedDecimals: 2 }
            description: The total cost (in dollars) of compute based on the total bytes billed.

    # dbt model attributes
    columns:
      - name: creation_time
        type: TIMESTAMP
        description: Time the job was created.
        meta: { hashboard: { primaryDate: true } }
      - name: project_id
        type: STRING
        description: The ID of the project.
      - name: user_email
        type: STRING
        description: Email address or service account of the user who ran the job.
      - name: job_id
        type: STRING
        description: The ID of the job. For example, bquxjob_1234.
        meta: { hashboard: { primaryKey: true } }
      - name: transaction_id
        type: STRING
        description: ID of the transaction in which this job ran, if any.
      - name: job_type
        type: STRING
        description: The type of the job. Can be QUERY, LOAD, EXTRACT, COPY, or NULL. A NULL value indicates an internal job, such as a script job statement evaluation or a materialized view refresh.
        tests:
          - accepted_values:
              values: ["QUERY", "LOAD", "EXTRACT", "COPY"]
      - name: statement_type
        type: STRING
        description: The type of query statement. For example, DELETE, INSERT, SCRIPT, SELECT, or UPDATE. See [QueryStatementType](https://cloud.google.com/bigquery/docs/reference/auditlogs/rest/Shared.Types/BigQueryAuditMetadata.QueryStatementType) for list of valid values.
      - name: start_time
        type: TIMESTAMP
        description: Start time of this job.
      - name: end_time
        type: TIMESTAMP
        description: End time of this job.
      - name: state
        type: STRING
        description: Running state of the job. Valid states include PENDING, RUNNING, and DONE.
        tests:
          - accepted_values:
              values: ["PENDING", "RUNNING", "DONE"]
      - name: cache_hit
        type: BOOLEAN
        description: Whether the query results of this job were from a cache. If you have a multi-query statement job, cache_hit for your parent query is NULL.
      - name: referenced_tables
        type: STRING
        description: Array of tables referenced by the job. Only populated for query jobs.
      - name: is_error
        type: BOOLEAN
        description: Whether the query resulted in an error.
Reviewing and previewing the change
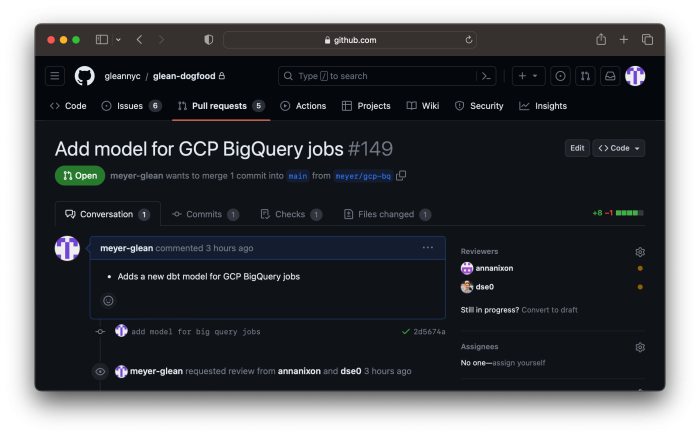
Once I was satisfied with the model, I opened a pull request with my changes in our dataops repository. I tagged some colleagues (thanks, Dan & Anna!) for code review.
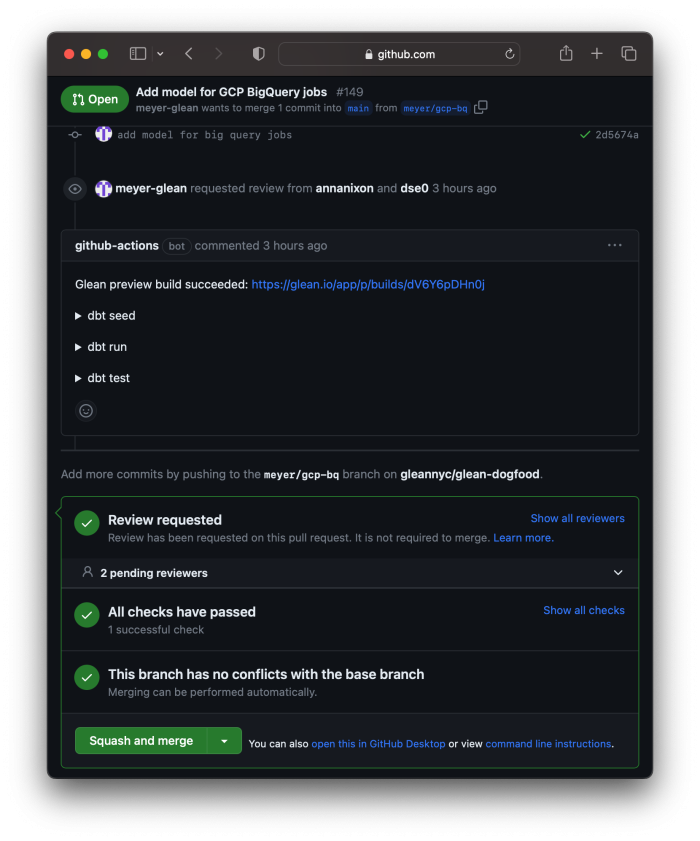
A few minutes later, I got a notification that our continuous integration had succeeded. We use GitHub Actions to automatically run our dbt workflow and create a Hashboard Preview build for open pull requests. Each pull request gets its own BigQuery dataset, so all of the preview links continue to work simultaneously.
The preview looks good, but during review, Anna spotted an issue with the model: Google Cloud Platform charges per tebibyte (TiB), not terabyte (TB) — that means we should be dividing the number of bytes billed by POW(1024, 4), not POW(10, 12). Whoops!
If I had made a mistake in the dbt syntax, the GitHub Action would fail and I would be able to see all of the logs and error messages with a single click.
Deploying to production
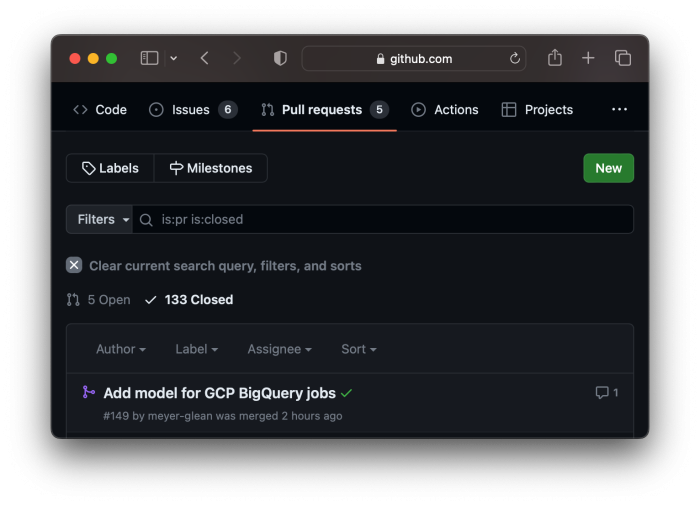
Once I pushed a fix to the model to the pull request, the CI ran again and gave me another green checkmark. With Anna’s stamp of approval, I merged the pull request into our main branch, where it will forever live (and be documented) until the end of time:
Once the pull request was merged, it triggered yet another GitHub Action to deploy the changes to production. And that’s it! Now, my team can start exploring the data to understand which kinds of queries are expensive, and to optimize our pipelines accordingly.
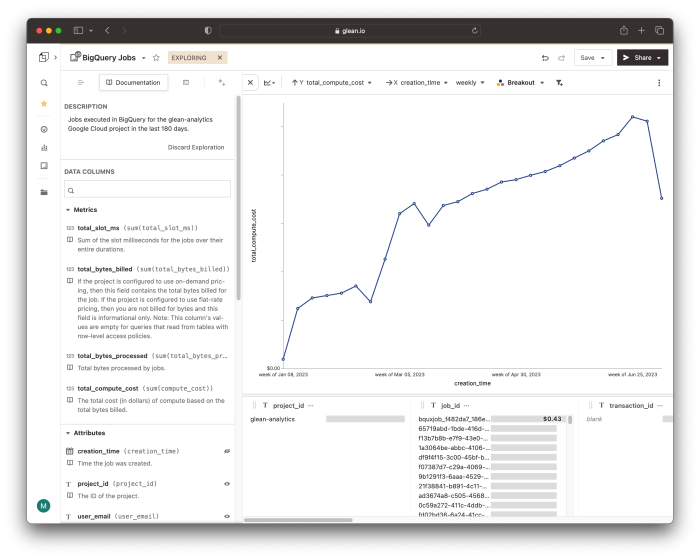
Woah...certainly, there is some room for improvement here!
I’ve simplified the story a bit for the sake of illustration. There were actually several rounds of review (and even followup pull requests) to converge on this model. Even now, we’re making improvements to our metrics and updating our documentation — all without breaking dashboards or presenting inconsistent views to our stakeholders.
What could DataOps mean for you?
At Hashboard, we’re focused on building a collaborative data culture. An ergonomic BI as Code workflow with automated builds, previews, and deployments is central to making that data culture feel good. People really want to use data to answer questions and make better business decisions when its presentation is clear, intuitive, and, above all, consistent. But the converse is also true: without discipline and processes, data becomes noise and using it becomes a chore.
We’re getting ready to share our automations with the world in the hopes that others might find them useful or draw inspiration. I hope this example helps illustrate the value of DataOps, even if you end up using different tools or a different workflow.