
Try the BigQuery Cost Analyzer for yourself here: https://www.bigquerycost.com/
Here at Hashboard, we use BigQuery as our data warehouse of choice to store our own analytics events. We also love dogfooding our product and analyzing our own data, including data about our BigQuery spending.
Historically, sharing logic from BI tools has been hard. If you solved something at one company, it would be challenging to move that logic to another company. But with our code-based-specification, building templates that work between organizations is easy.
We’ve previously written about using dbt + Github actions to track BigQuery expenditure in Hashboard. The BigQuery Cost Analyzer takes that idea but makes setup even easier – it’s 100% free (no credit card required) and all you need to get started is a Google account in a BigQuery project.
Why did we make this?
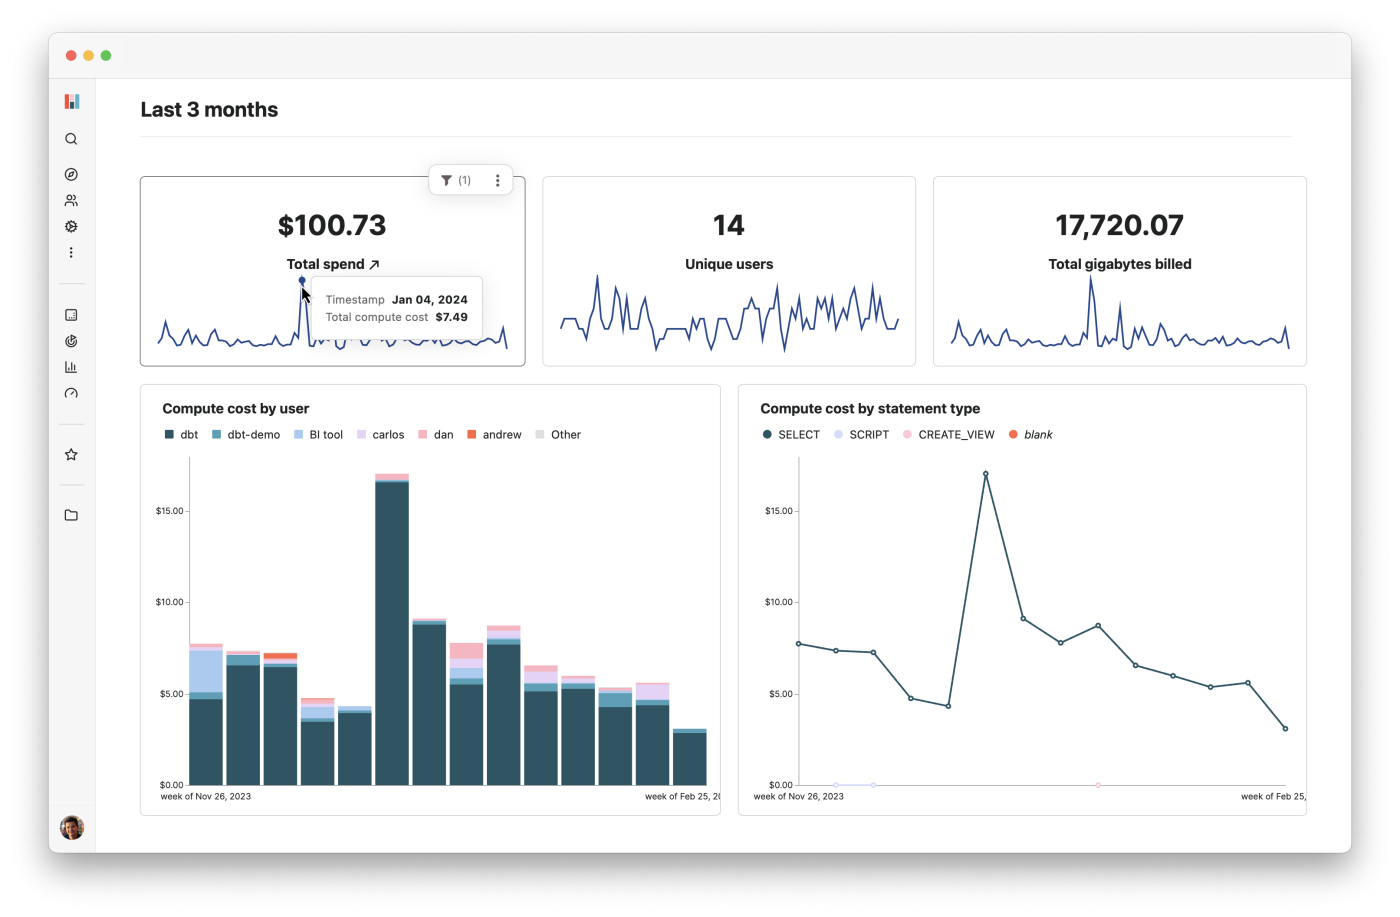
Looking at the BigQuery Cost dashboard we’d set up for ourselves, we realized that our costs were climbing over time, and went to investigate the issue – looking at the breakdown by table, query, user…
After some poking around, we found that the majority of these costs came from running dbt continuously, and rebuilding our tables every time. We reconfigured our continuous runs so that they were incremental, only appending new rows to the end of our table, and only rebuilt our tables when a dbt pull request was merged. This was a massive inefficiency that we hadn’t noticed up until that point.
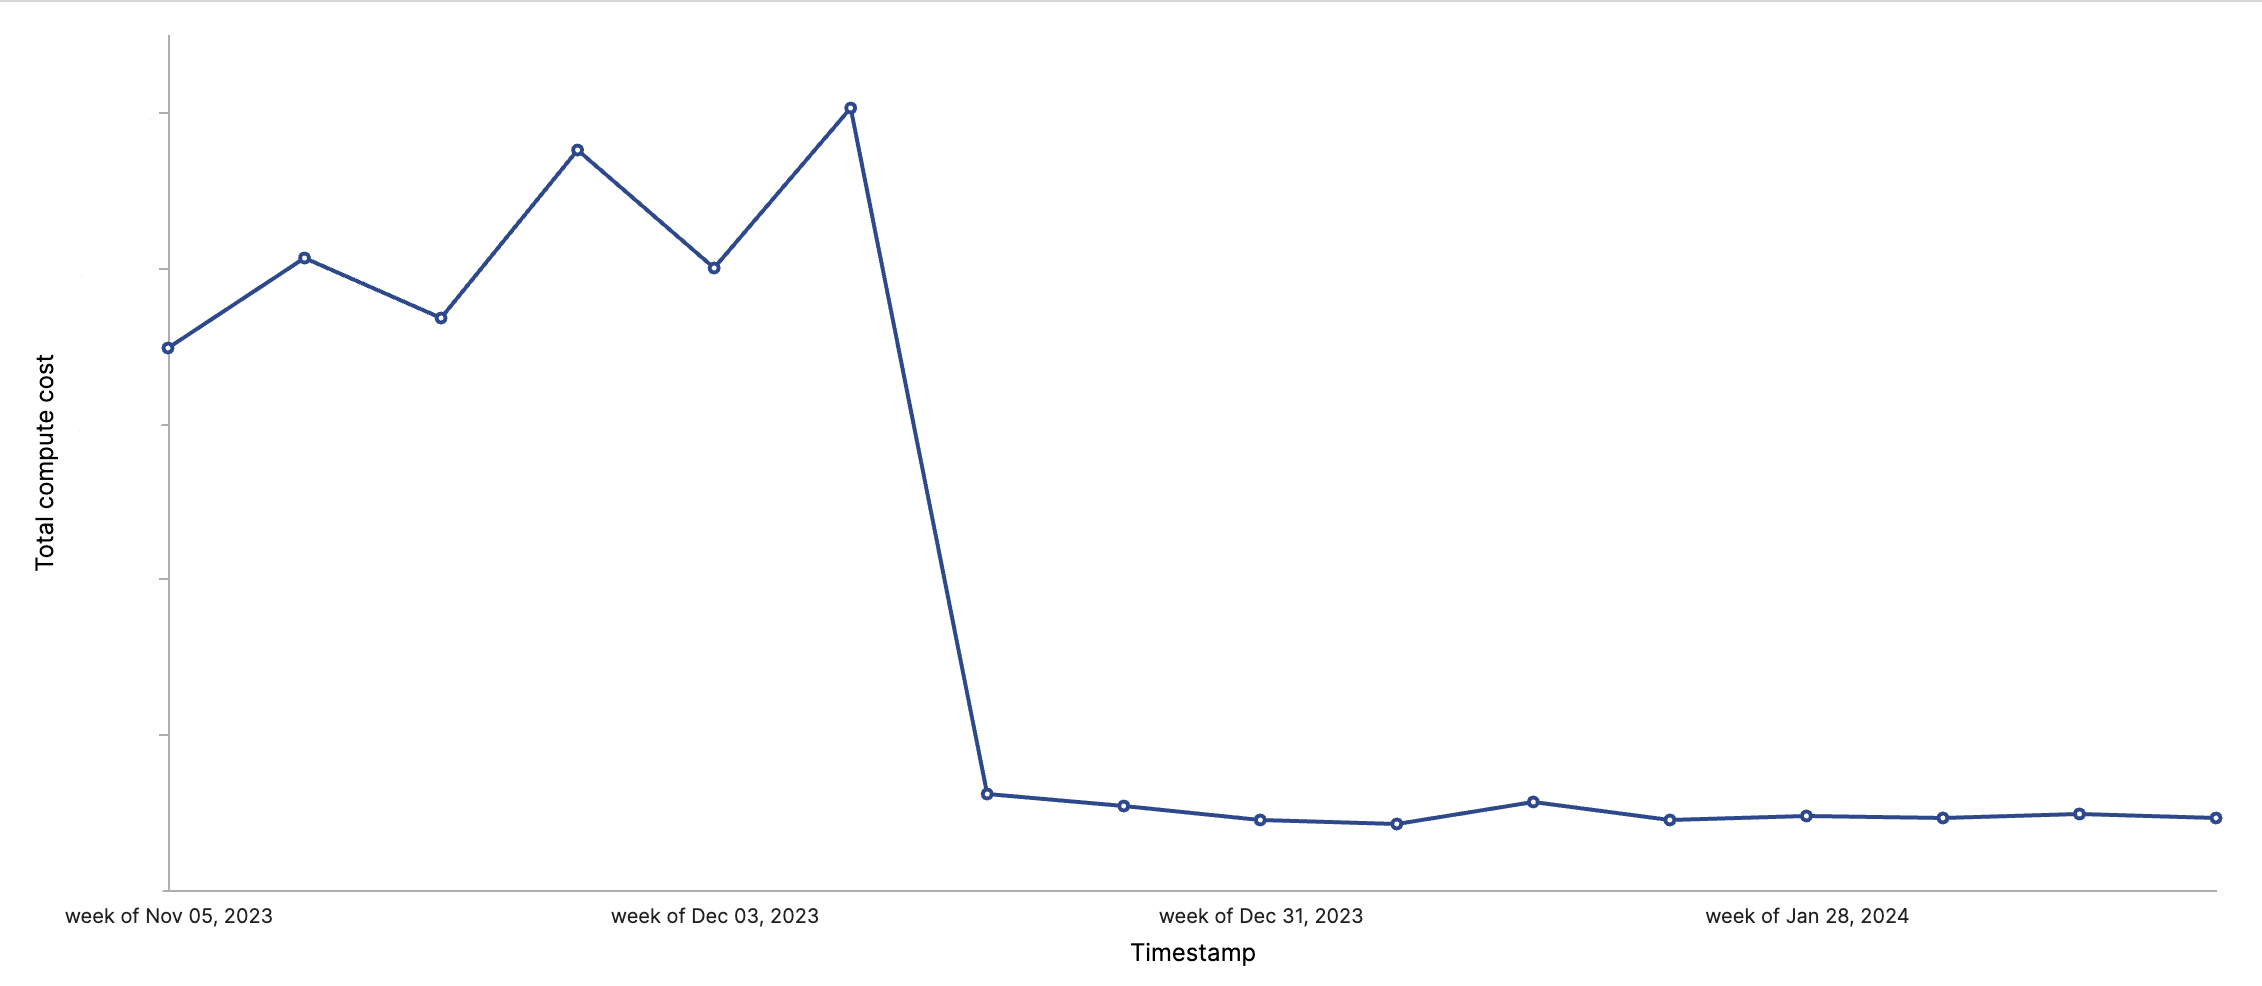
You can actually see how dramatically our costs fell after we figured this out – in one week after the change, we saw a 90% decrease in spending.
 From here, the idea of a self-serve BigQuery Cost Analyzer was born – what if we could automate this process and enable users to bootstrap a Hashboard project to analyze BigQuery costs with the press of a button?
How does it work?
Getting set up is simple & free. Clicking Get access at bigquerycost.com, you’ll be redirected to a signup flow where you’ll be prompted to sign in with Google a couple of times, first to create a project and then to and grant Hashboard permission to see your BigQuery data. Creating a BigQuery Cost Analyzer project won’t affect any existing Hashboard projects that you’re a member of.
Then, it’s time to select your projects – you can select as many as you want that you have permission for. (You’ll need the ability to create jobs and access the INFORMATION_SCHEMA view).
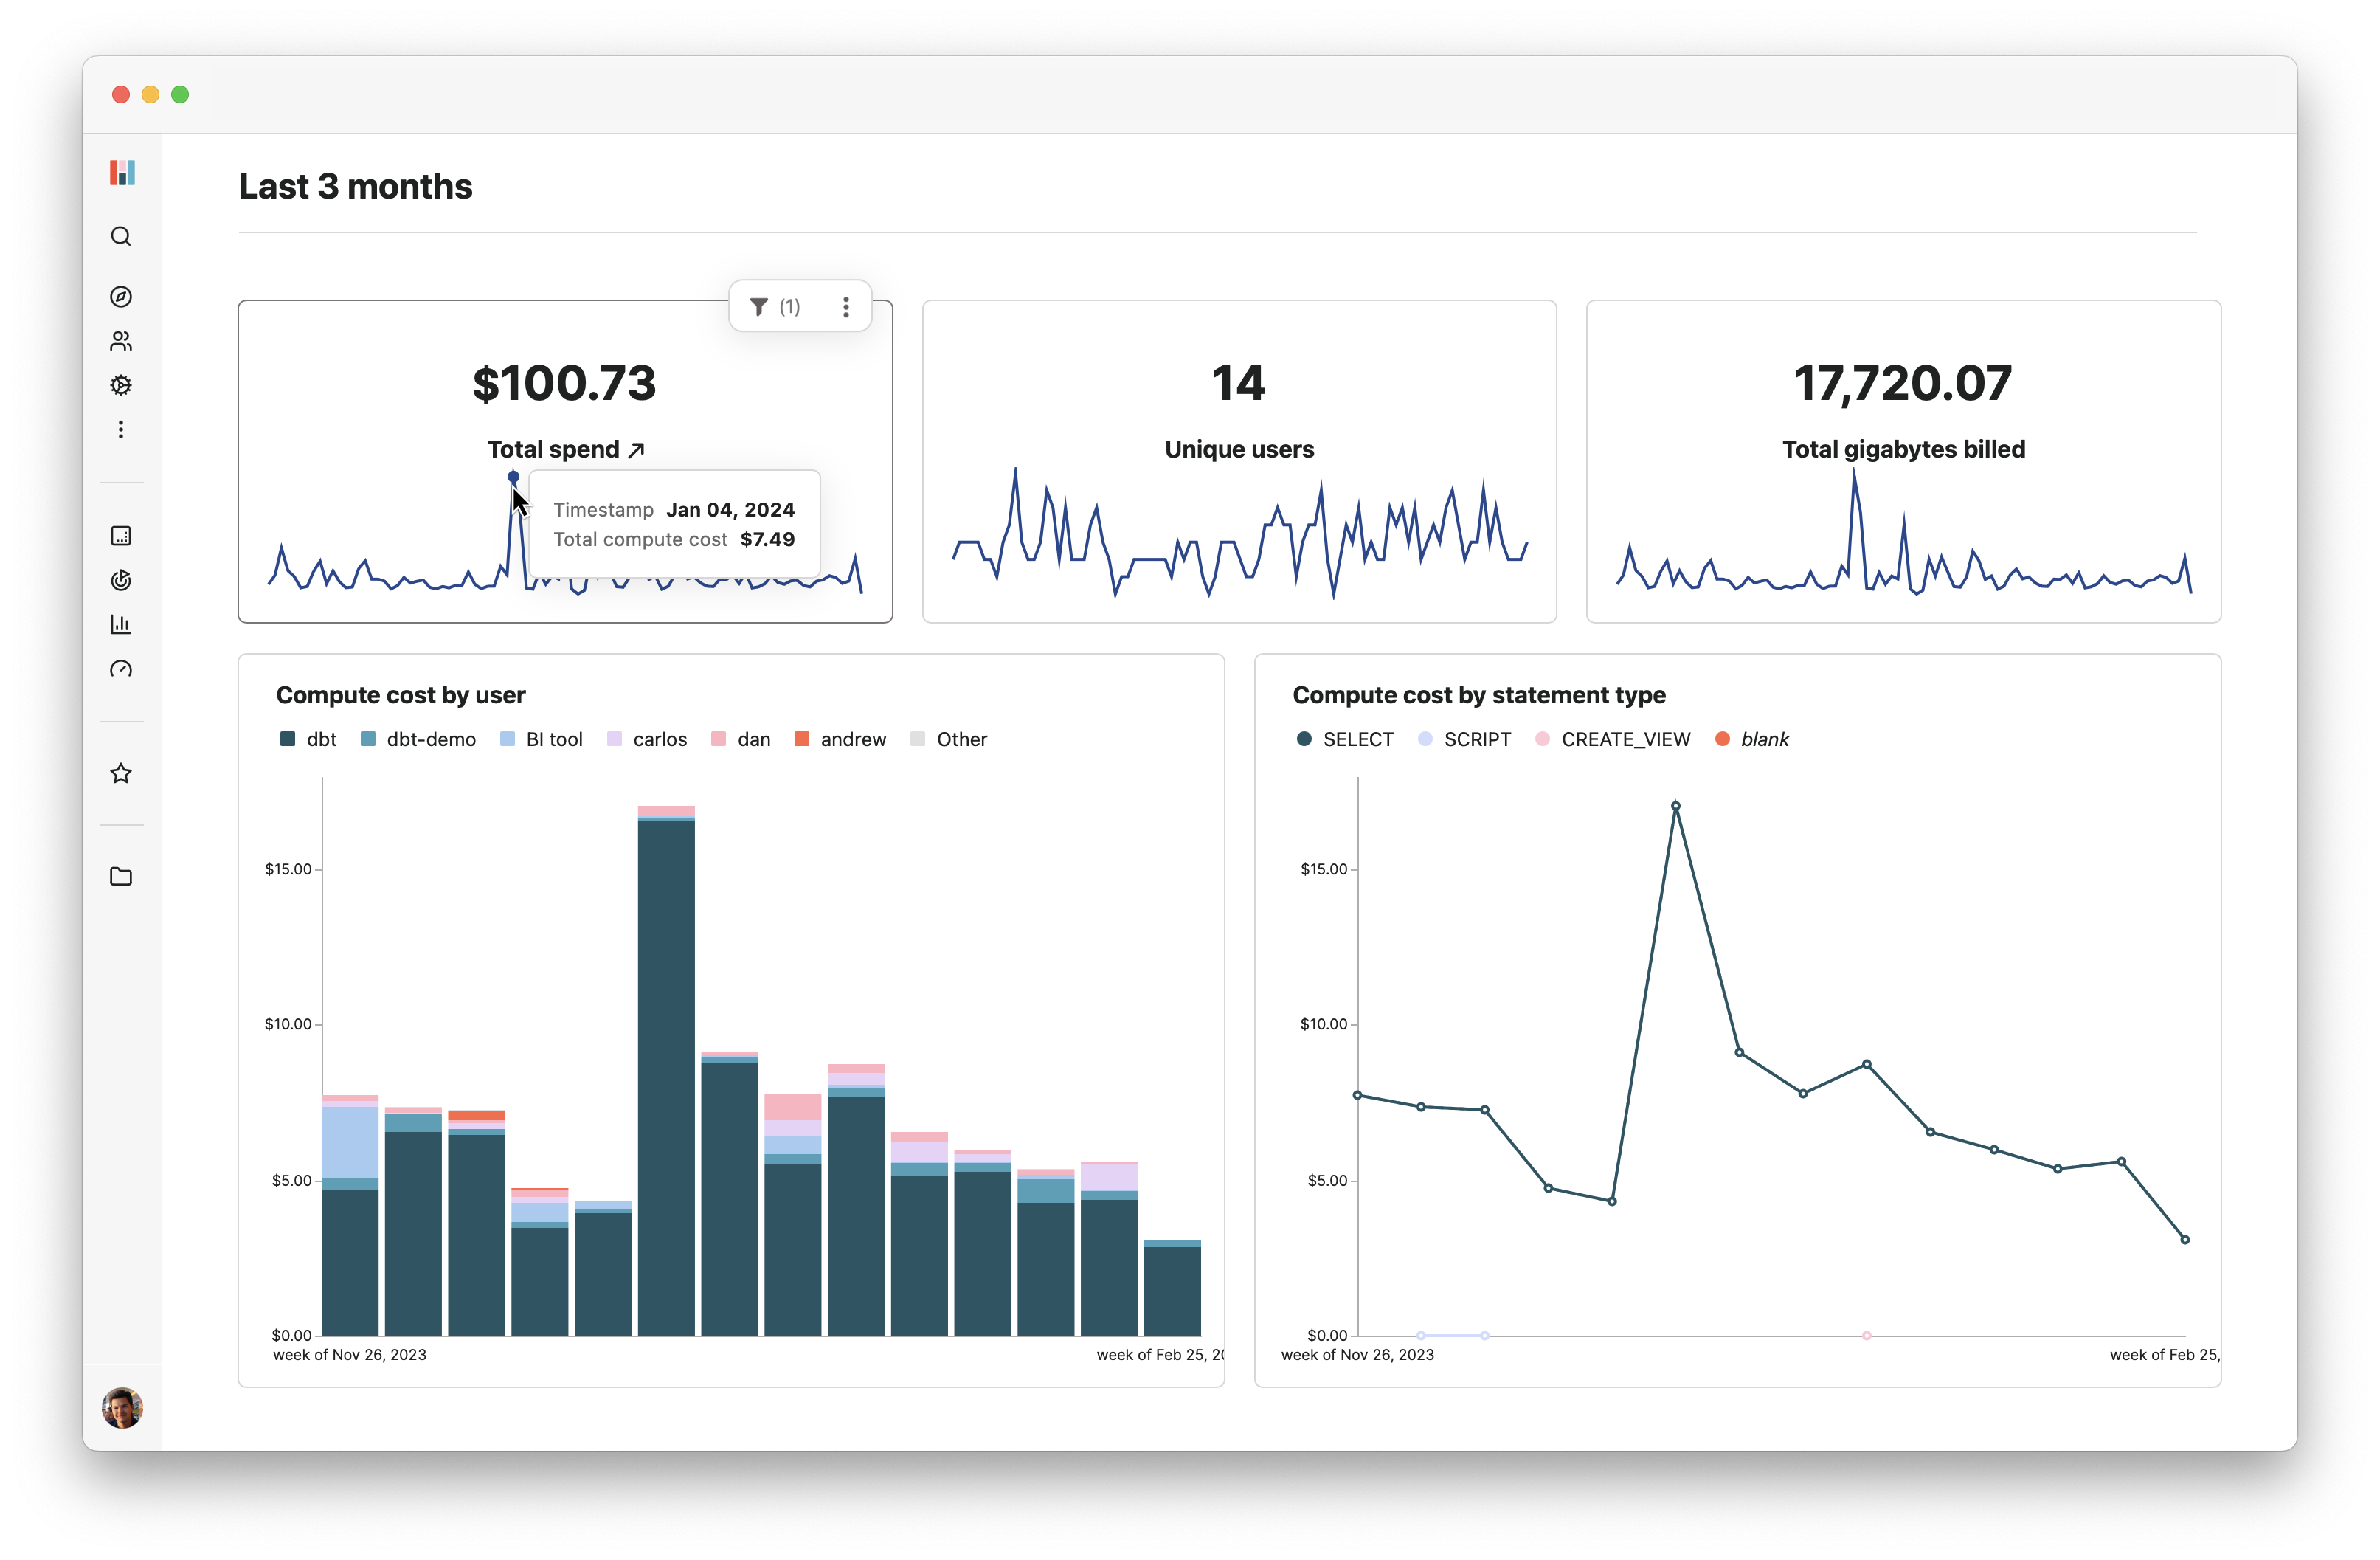
And that’s it, you’ll be redirected to a new dashboard in your project! You now have a fully functional Hashboard project set up in under a minute and ready to be explored.
 What’s happening under the hood
For each project you’ve selected, we create a datasource from the credentials generated when you authenticate with Google OAuth. (After the project is created, you’ll have the option to migrate these data connections to a BigQuery service account.)
Every BigQuery project comes with its own INFORMATION_SCHEMA view that contains metadata about the project and tables. Fields like bytes billed, slot ms, referenced tables, user email, and job type are all being tracked.
Although spend isn’t directly provided in INFORMATION_SCHEMA, it can be easily calculated from other fields.
The default BigQuery pricing plan is $6.25 per TiB billed, which is what we assume – but if you’re on a different plan, it’s really easy to change this (keep reading to see how).
The actual resources we’re generating – your model, saved explorations, metrics, dashboards, even your homepage and color palette – are being deployed into your project using code-based resource configurations. The YML configuration files that define these resources are all publicly available in our GitHub repo of examples. You can find them under the bq_cost_analyzer folder here.
Getting the most out of your data
We’ve populated your Hashboard project with resources that we think will help you find insights, but if you feel like your dashboard isn’t useful for you – like maybe you’re not on the default BigQuery pricing plan and our numbers are wrong – everything is interactive and adjustable. Here are a few tips to get started.
Changing compute_cost calculation
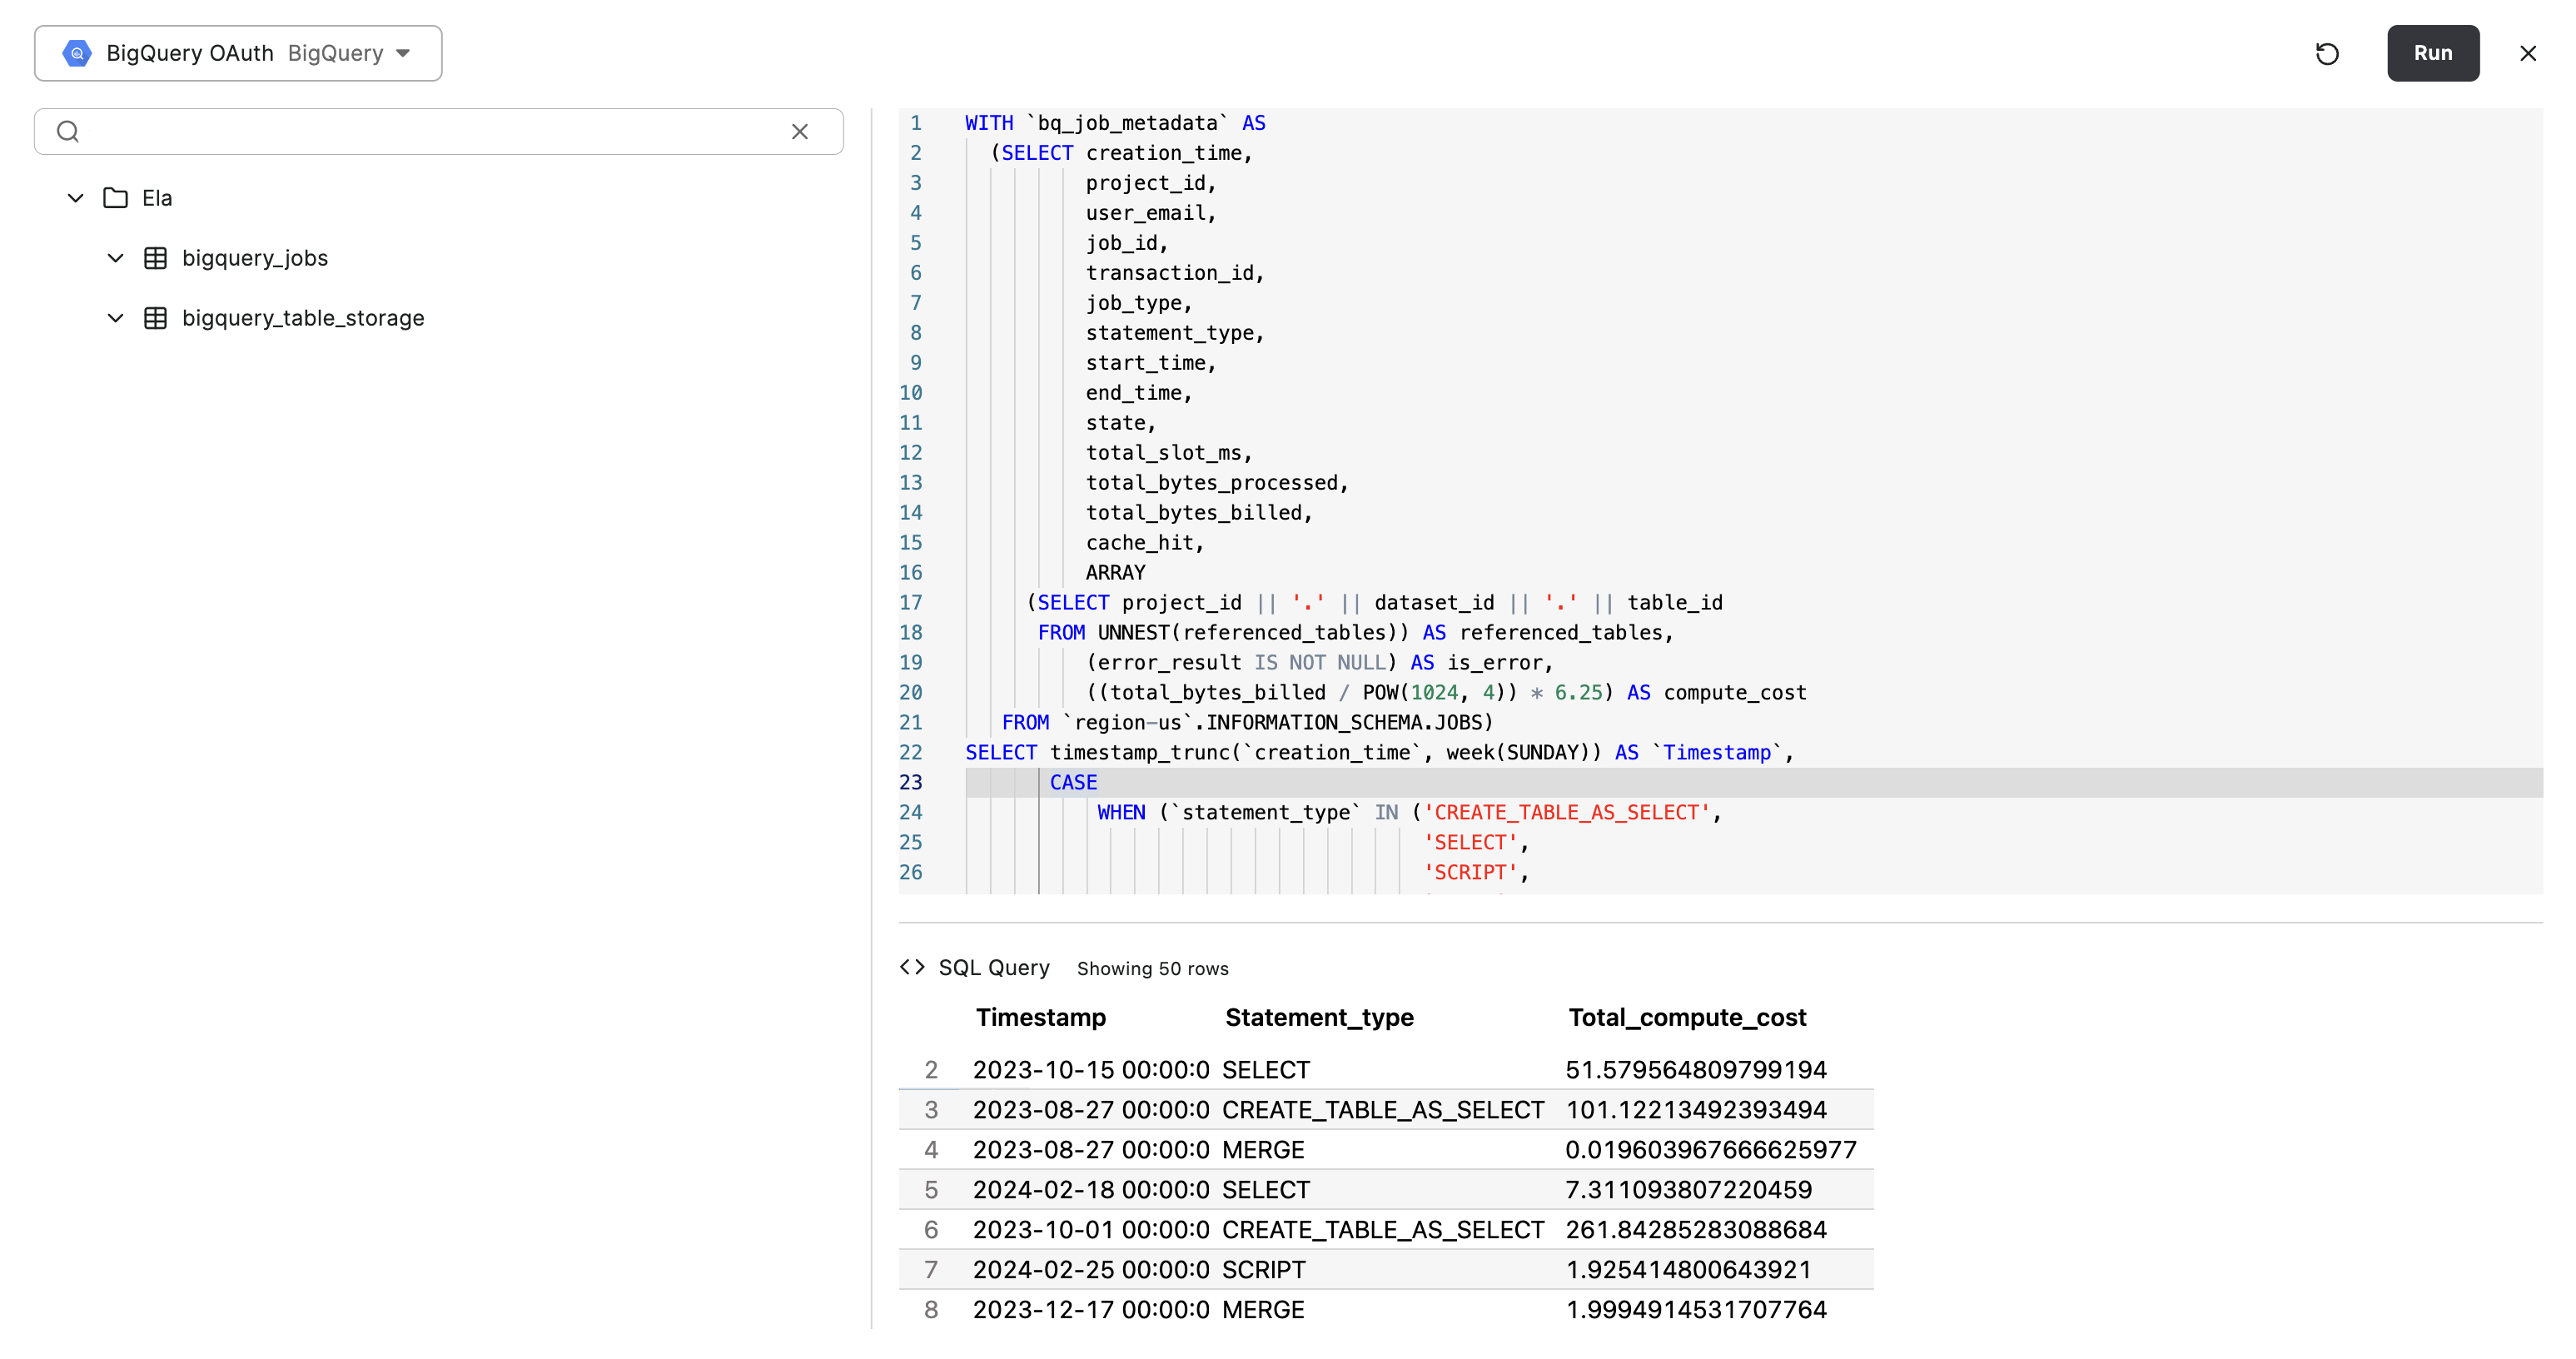
First, find your model via the Data models page and enter the Model Builder. On the left pane, you’ll be able to Edit the Custom SQL table and then Open SQL editor. You’ll be able to see the SQL query that was used to define the table that your model builds attributes and measures on top of:
SELECT
    creation_time,
    project_id,
    user_email,
    job_id,
    transaction_id,
    job_type,
    statement_type,
    start_time,
    end_time,
    state,
    total_slot_ms,
    total_bytes_processed,
    total_bytes_billed,
    cache_hit,
    ARRAY(
        SELECT
            project_id || '.' || dataset_id || '.' || table_id
        FROM
            UNNEST(referenced_tables)
    ) AS referenced_tables,
    (error_result is not NULL) as is_error,
    ((total_bytes_billed / POW(1024, 4)) * 6.25) as compute_cost
FROM
    `region-us`.INFORMATION_SCHEMA.JOBS
You can see that compute_cost is defined here as (total_bytes_billed / POW(1024, 4)) * 6.25. You can change this to whatever you’d like and when you save your model, dependent resources will automatically be updated.
Region
In the last line, you’ll also notice that we assume you want to see jobs that were performed in region-us. Feel free to change this line if you want to see jobs from a different region.
SQL Runner
Another easy way to play around with your data is by using the SQL Runner, which you can open either in the “More” menu of a saved exploration or anywhere in Hashboard using our keyboard shortcut, CMD+J . You can use this to run one-off SQL queries, either from scratch or based off of the current SQL query underlying your saved exploration.
 Sharing
When you’re happy with what your project looks like, there are lots of ways to share it with others:
You can invite users into your project using the “People” page
In the “Share” button in the top right of a dashboard or saved exploration, you can choose to send it as a one-off Slack message or email, or as a scheduled recurring report
You can create a publicly accessible link for a dashboard or saved exploration, available for anyone to see