Choosing the Right BI Tool to Grow a Data-Driven Culture: Comparing Hashboard, Looker, Metabase, and Tableau


Empowering all levels of an organization to make high tempo, data driven decisions is crucial for driving innovation, improving performance, and building a shared understanding of your business. Building a collaborative data culture requires accessible and collaborative tools.
Business Intelligence (BI) tools have emerged as the cornerstone of a data-driven organization, providing the means to transform complex data into actionable insights. Yet, with a myriad of BI tools available, selecting the one that best aligns with your organization's aspirations can be challenging.
Why you should trust me (and why you shouldn’t)
I’ve built and used data products at one of the biggest tech companies in the world, a successful startup right as they got acquired, and at a seed-stage startup. Along the way, I’ve used and advised on a broad range of commercial and internally developed BI solutions.
Notably, I work at Hashboard as a Technical Product Manager, but I’ve also seen other tools succeed and want to highlight when they’re the right choice depending on your needs.
What does self service BI even mean?
When I talk about "Self-Service BI", I’m referring to tools that allow users—regardless of their technical expertise—to independently access and answer their questions using data.
Ever been in a position where you're reliant on a data analyst to make sense of data? Traditional BI tools create a divide: data specialists answer questions, and business users consume these answers. This setup can lead to bottlenecks, with users dependent on data teams for every single question. The data team often doesn’t have the capacity to answer everyone’s questions, forcing business users to make decisions based entirely on their intuition. Another common result is that data teams waste effort building resources no one uses.
Self-service BI, on the other hand, integrates data exploration into everyone's workflow, promoting rapid, confident decision-making. This independence is a key driver for a data-driven culture, empowering all within an organization to make data-informed decisions swiftly and confidently.
So, what key features facilitate this?
Governed Metrics and Dimensions
Centralizing metrics ensures accuracy across all explorations, reducing the risk of errors and misunderstandings. Similarly, clearly defining dimensions and attributes, such as what qualifies an active account, is crucial. The metric definitions ideally include organizing them in a way that mirrors your organization, promoting accountability and alignment. This arrangement allows users to understand not only their metrics, but also the broader organizational ones, and how these metrics interrelate.
Exploratory Data Analysis
When a metric exhibits an unexpected shift, business users need to be able to identify why. This involves drilling down into the data, breaking it out by various dimensions to pinpoint what's driving the change. For instance, if shipping volume dips, a breakout by carrier can reveal if a specific carrier's performance is the cause. Identifying the root cause usually takes more than one level of questioning. Users must be able to quickly test different breakouts and combinations of breakouts. This necessitates flexible questioning beyond what a static dashboard can provide.
Context and Collaboration
Sometimes, data doesn't tell the whole story, and contextual information is needed. A national holiday might explain a drop in orders, but it's not captured in the raw data. Self-service BI should allow for the incorporation of such knowledge, enabling users to make sense of the data in its fuller context. Practical features for this are commenting and mentioning, but even descriptions can help.
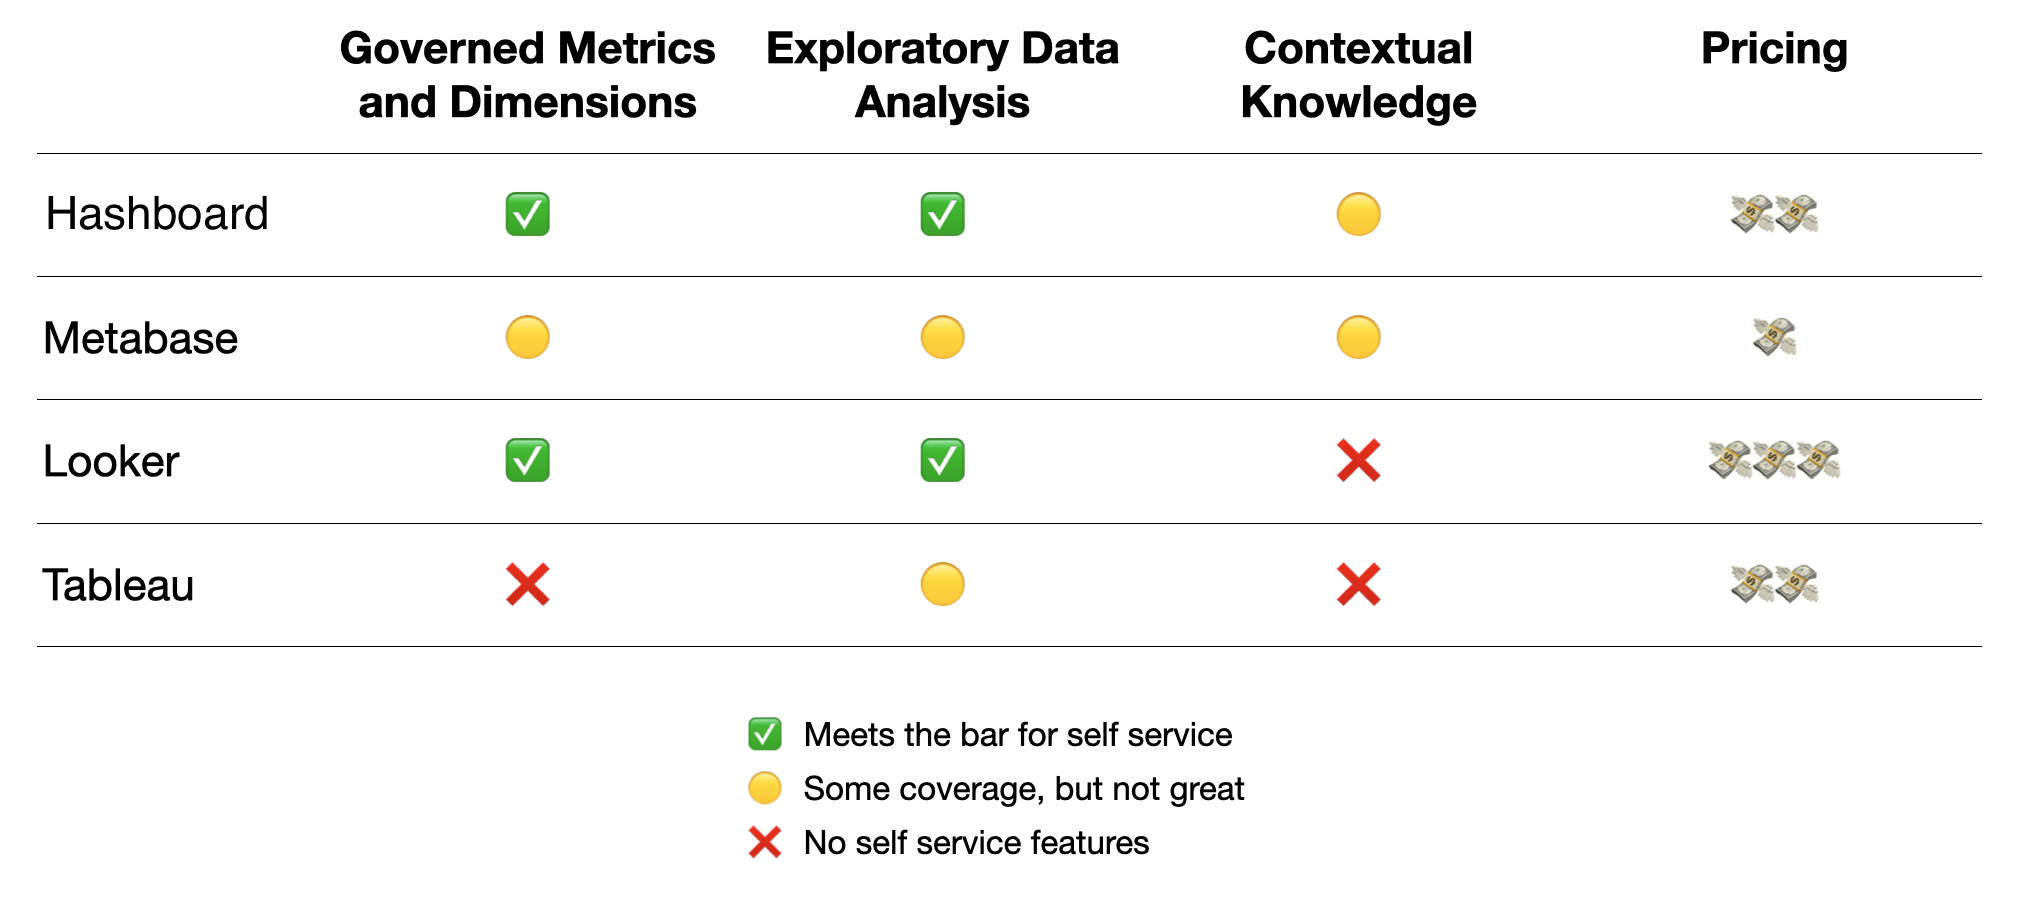
Comparing Hashboard, Metabase, Looker, and Tableau
Hashboard
Who Hashboard is for: Data teams building tools for non-technical users to be able to answer their own questions with as little overhead as possible using modern version control and CI/CD pipelines.
Governed Metrics and Dimensions
Hashboard has a metrics-focused lightweight semantic layer. It supports model joining and is safe for non technical users to add breakouts and change the granularity of metrics.
Exploratory Data Analysis
Hashboard automatically builds a visual data explorer as an interface for users to analyze metrics without SQL. Users can easily slice and group data via visualizations while metrics are safely recalculated based on the semantic layer.
Contextual Knowledge
There is no commenting or mentioning system. Since most users are able to create their own dashboards, users can use markdown blocks as a way to store context. Descriptions fields for metrics and attributes show up consistently in the app.
Pricing
$4.2k per year for up to 10 users. https://hashboard.com/pricing
Metabase
Who Metabase is for: Early teams where everyone knows SQL and are looking for a self-hosted open source solution.
Governed Metrics and Dimensions
Metabase has an extremely limited data modeling feature. Users cannot use Metabase data models to breakout and drill into metrics.
Exploratory Data Analysis
Metabase best serves users who know already know SQL. It is primarily a GUI for building SQL queries. Non technical users aren’t able to easily play with and test different cuts of data and metrics
Contextual Knowledge
There is no commenting or mentioning system, but there is an interesting events and timeline feature where users can can record events to surface in charts. (https://www.metabase.com/docs/latest/exploration-and-organization/events-and-timelines)
Pricing
Metabase is open source and can be self-hosted. There is also a commercially hosted option, but I’ve generally seen teams stick with the self hosted option. https://www.metabase.com/pricing/
Looker
Who Looker is for: Data-driven organizations that need a comprehensive, feature-rich dashboard tool with strict governance and can manage high operational costs.
Governed Metrics and Dimensions
Looker has a very sophisticated system of data modeling and joining which can be very powerful, but is also so complicated that business users can get confused about which slices of metrics are safe to calculate.
Exploratory Data Analysis
Looker has a data explorer where users can create their own visualizations based on the semantic layer defined by the data team. Users are able to create breakouts and create their own charts and tables. Metrics are generally safely recalculated based on the semantic layer, but can be sometime dangerous if the data team has allowed for many to many joining.
Contextual Knowledge
There is no commenting or mentioning system and end users aren’t able to make dashboards to store notes. Descriptions fields for metrics and attributes show up consistently in the Explore interface.
Pricing
$60k per year minimum. You need to pay both a platform cost and for user seats. https://cloud.google.com/looker/pricing
Tableau
Who Tableau is for: Less technical data teams and organizations that are willing to invest in training everyone on a specific tool. Primarily for creating dashboards, not interactive exploration.
Governed Metrics and Dimensions
Tableau doesn’t have centrally defined metrics and dimensions. All definitions only live within a workbook. Overtime, upstream changes in the data warehouse can lead to a lot of dead and broken dashboards.
Exploratory Data Analysis
Tableau can be a great unlock for less technical users who need to be able to create their own dashboards and has a very expressive visualization system. However, once those dashboards are uploaded, there’s no way for the other users to continue to explore the data.
Contextual Knowledge
There is no commenting or mentioning system and most users cannot create their own dashboards to store notes.
Pricing
Seat based pricing. $840 for first user per year. Additional users are cheaper. https://www.tableau.com/pricing/tableau-server
Summary
While all four tools strive to make data accessible, the chances of success at your organization of driving data driven decision making will vary depending on the technical knowledge of the users. Hashboard and Looker are explicitly designed for self service data exploration as a managed solution by the data team. Metabase is an open source option for SQL users. Tableau enables non technical users to make dashboards, but isn’t a real self service solution.
Appendix
Other options and why I didn’t include them
Hex: Very cool notebooks for technical analysts and data team. I would've loved to use this in any of my data roles. So far, I’ve mostly seen it work within data teams, not as a general BI tool for the rest of the organization. Requires SQL or Python knowledge (ideally both) to explore data effectively.
Mode: Expects everyone to learn SQL. I've seen Mode used at large companies and small ones, but the bet you need to make here is that everyone will eventually learn SQL. This doesn't meet my definition of self service.