A brief history of business intelligence, modern day data transformation and building trust along the way

A brief history of business intelligence:
In 1958, Hans Peter Luhn wrote the article “A Business Intelligence System”, outlining the challenge organizations were facing with overwhelming amounts of data and no efficient way to sift through it all. He argues the very valid point that humans alone could not possibly handle organizing and distributing data efficiently.
Sound familiar?
In Luhn's article, he envisioned a system that would encode documents, correlate them with user profiles using keywords, and then relay pertinent documents to the right users. This index was one of the early methods for information retrieval (or search), helping users identify pertinent information more quickly.
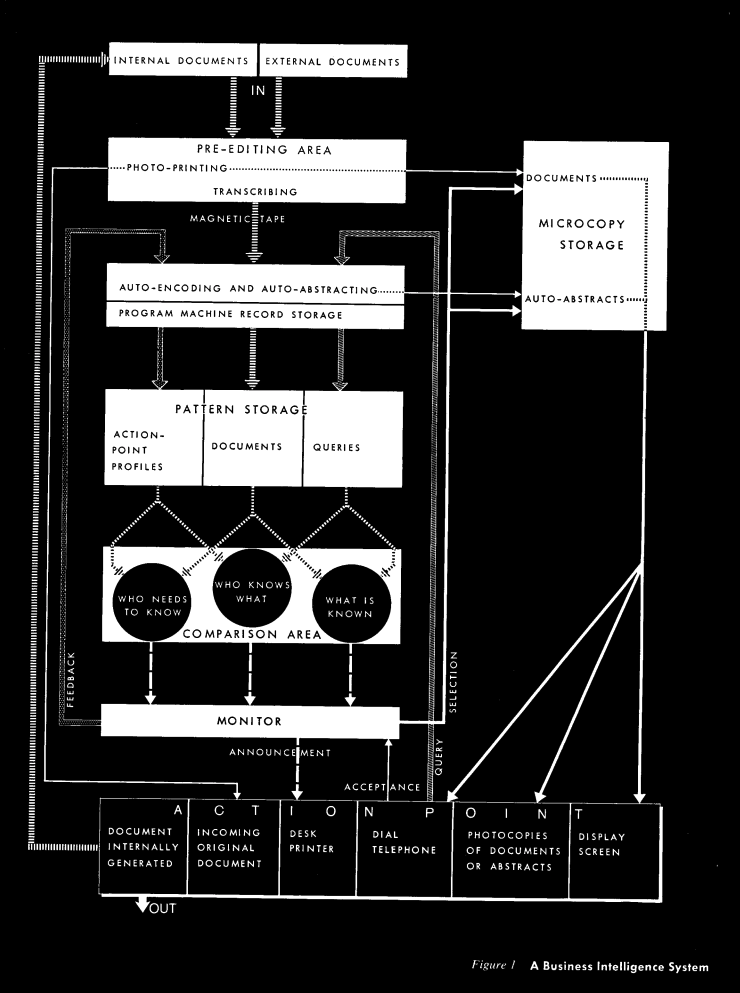 Source: IBM Journal, October 1958
Throughout the sixties and seventies, researchers worked on decision support systems. Personal computing came with spreadsheets… and today technology for wrangling data has never been more accessible. The term "Business Intelligence" (BI) is ubiquitous and integral to numerous organizational tech stacks and expansion blueprints. From simple spreadsheets to the mind-boggling landscape of machine learning, artificial intelligence and data (best captured by Matt Turk here) the the gamut of available tools is staggering.
For the uninitiated in data realms, here's a BI primer:
BI facilitates data-driven decisions by primarily converting raw data (housed in data warehouses or various files) into actionable insights.
“BI” often encompasses various tools (i.e. Tableau, Hashboard 🙋♀️ , Metabase), along with the underlying processes and methodologies. These resources enable teams to assimilate data from both internal systems and external sources, prepare it for analysis, and present it visually.
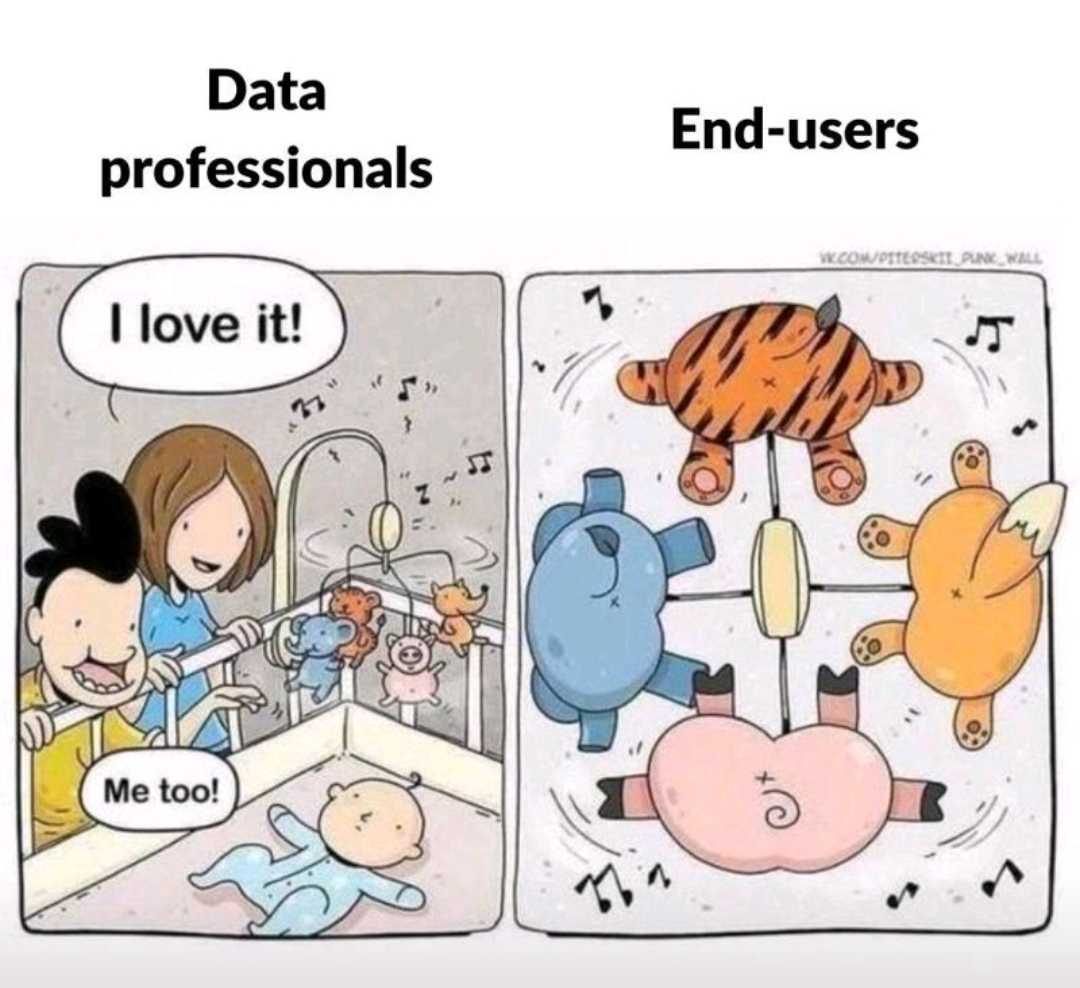
Typically, organizations use BI tools for the ‘last mile’ of their data work. This process involves creating reports, dashboards, and visual narratives for their end users.
The term ‘End Users’ can refer to anyone who is consuming the data and using it to make strategic decisions, identify opportunities or risk (i.e. executives, CX teams, RevOps teams)
Modern day solutions, historical problems:
Luhn’s challenge in 1958 still rings true in 2023 - how can we efficiently take large amounts of data, organize it and get it in the hands of the right users?
Okay obviously this problem has gotten easier with the incredible advancements of modern data warehouses, ETL tools, etc. BUT anyone working in data will tell you it’s not as simple as standing up a modern tech stack at your organization and calling it a day. Once you accomplish all of that work, how do you ensure that those users understand and trust the data provided to them?
 Cue the cycles of frustration for data teams and stakeholders 😭
This frustration and pain that folks feel on both sides of the aisle is something I hear from talking with Hashboard customers and prospects every day.
Data teams are often hesitant to provide end users with unbridled data access. Without the proper context and education this can cause mass confusion, often prompting an endless stream of “why” questions in Slack. In some cases this can create pressure for data teams to learn deep domain knowledge when they simply don’t have capacity to do that.
On the other hand, business stakeholders often feel frustrated that the metrics they’re measured on are trapped in a tool that doesn’t feel accessible to them. They may question how the numbers were prepared and realize gaps internally around definitions of things like ‘customer,’ ‘revenue,’ and ‘product.’ They may run into similar capacity constraints if they’re asked to learn SQL or become a data viz expert on top of their day jobs.
No single tool is going to solve the entirety of the trust challenge - this is always going to come down to soft skills, thoughtful communication and mutual empathy. Here are some great posts on how to work on building that trust between teams. What I’m going to focus on in this post are some of the tooling solutions that can help teams ease the pain.
Bridging the gap with dbt:
BI tools typically signify the final lap in the data journey. For data to reach this stage, it's imperative to have undergone methodical organization and transformation. Data teams need to build trust throughout the entire process; when this is done well, they’re able to provide their broader organization with self-service access having collaborated with key stakeholders along the way. Pairing the collaboration with the right domain experts and building the appropriate guardrails for data exploration and metric tracking opens the door to the mythical land of self-service.
This stage is where dbt (data build tool) comes into play; dbt focuses on the ‘T’ in the ETL process (extract, transform, load). With its growing user base, dbt equips both engineers and analysts to deftly mold raw data into digestible formats.
For those new to the data arena, here's a brief dbt overview:
At it’s core, dbt is SQL centric, all models are a SQL select statement; you define transformations, aggregations, and logic to turn raw data into more usable tables or views
Added benefits of dbt include version controlling by integrating through systems like Git as well as the ability to add tests to data models and auto-generated documentation to provide clarity around data lineage and transformations
The power of dbt has enabled teams to work faster as they can rapidly iterate on their data models and accommodate quick turns in the business, ensure version control is in place and get SQL-savvy team members up to speed quickly
So let’s tie dbt back to the history of BI, modern data solutions and building trust:
Luhn's seminal 1958 work highlighted the human limitation in efficient data management and timely, relevant dissemination.
Since then, thousands of companies have built products to help solve these challenges (we’re one of them 🙋♀️). The exciting part about solving this challenge in 2023 is that while datasets have continued to get bigger, there's been a parallel evolution of tools and teams to foster data literacy.
Hashboard serves as the springboard to get data directly into stakeholder’s hands. Repeatedly, we’ve seen teams that have invested in the data transformation and modeling stages reap dividends. This foundational work paves the way for best in class stakeholder empowerment, enabling them to explore data independently and discover valuable insights.
The secret sauce? A unified metric set underpins all operations, supplemented by version control, previews, documentation synchronization, and robust resource management.
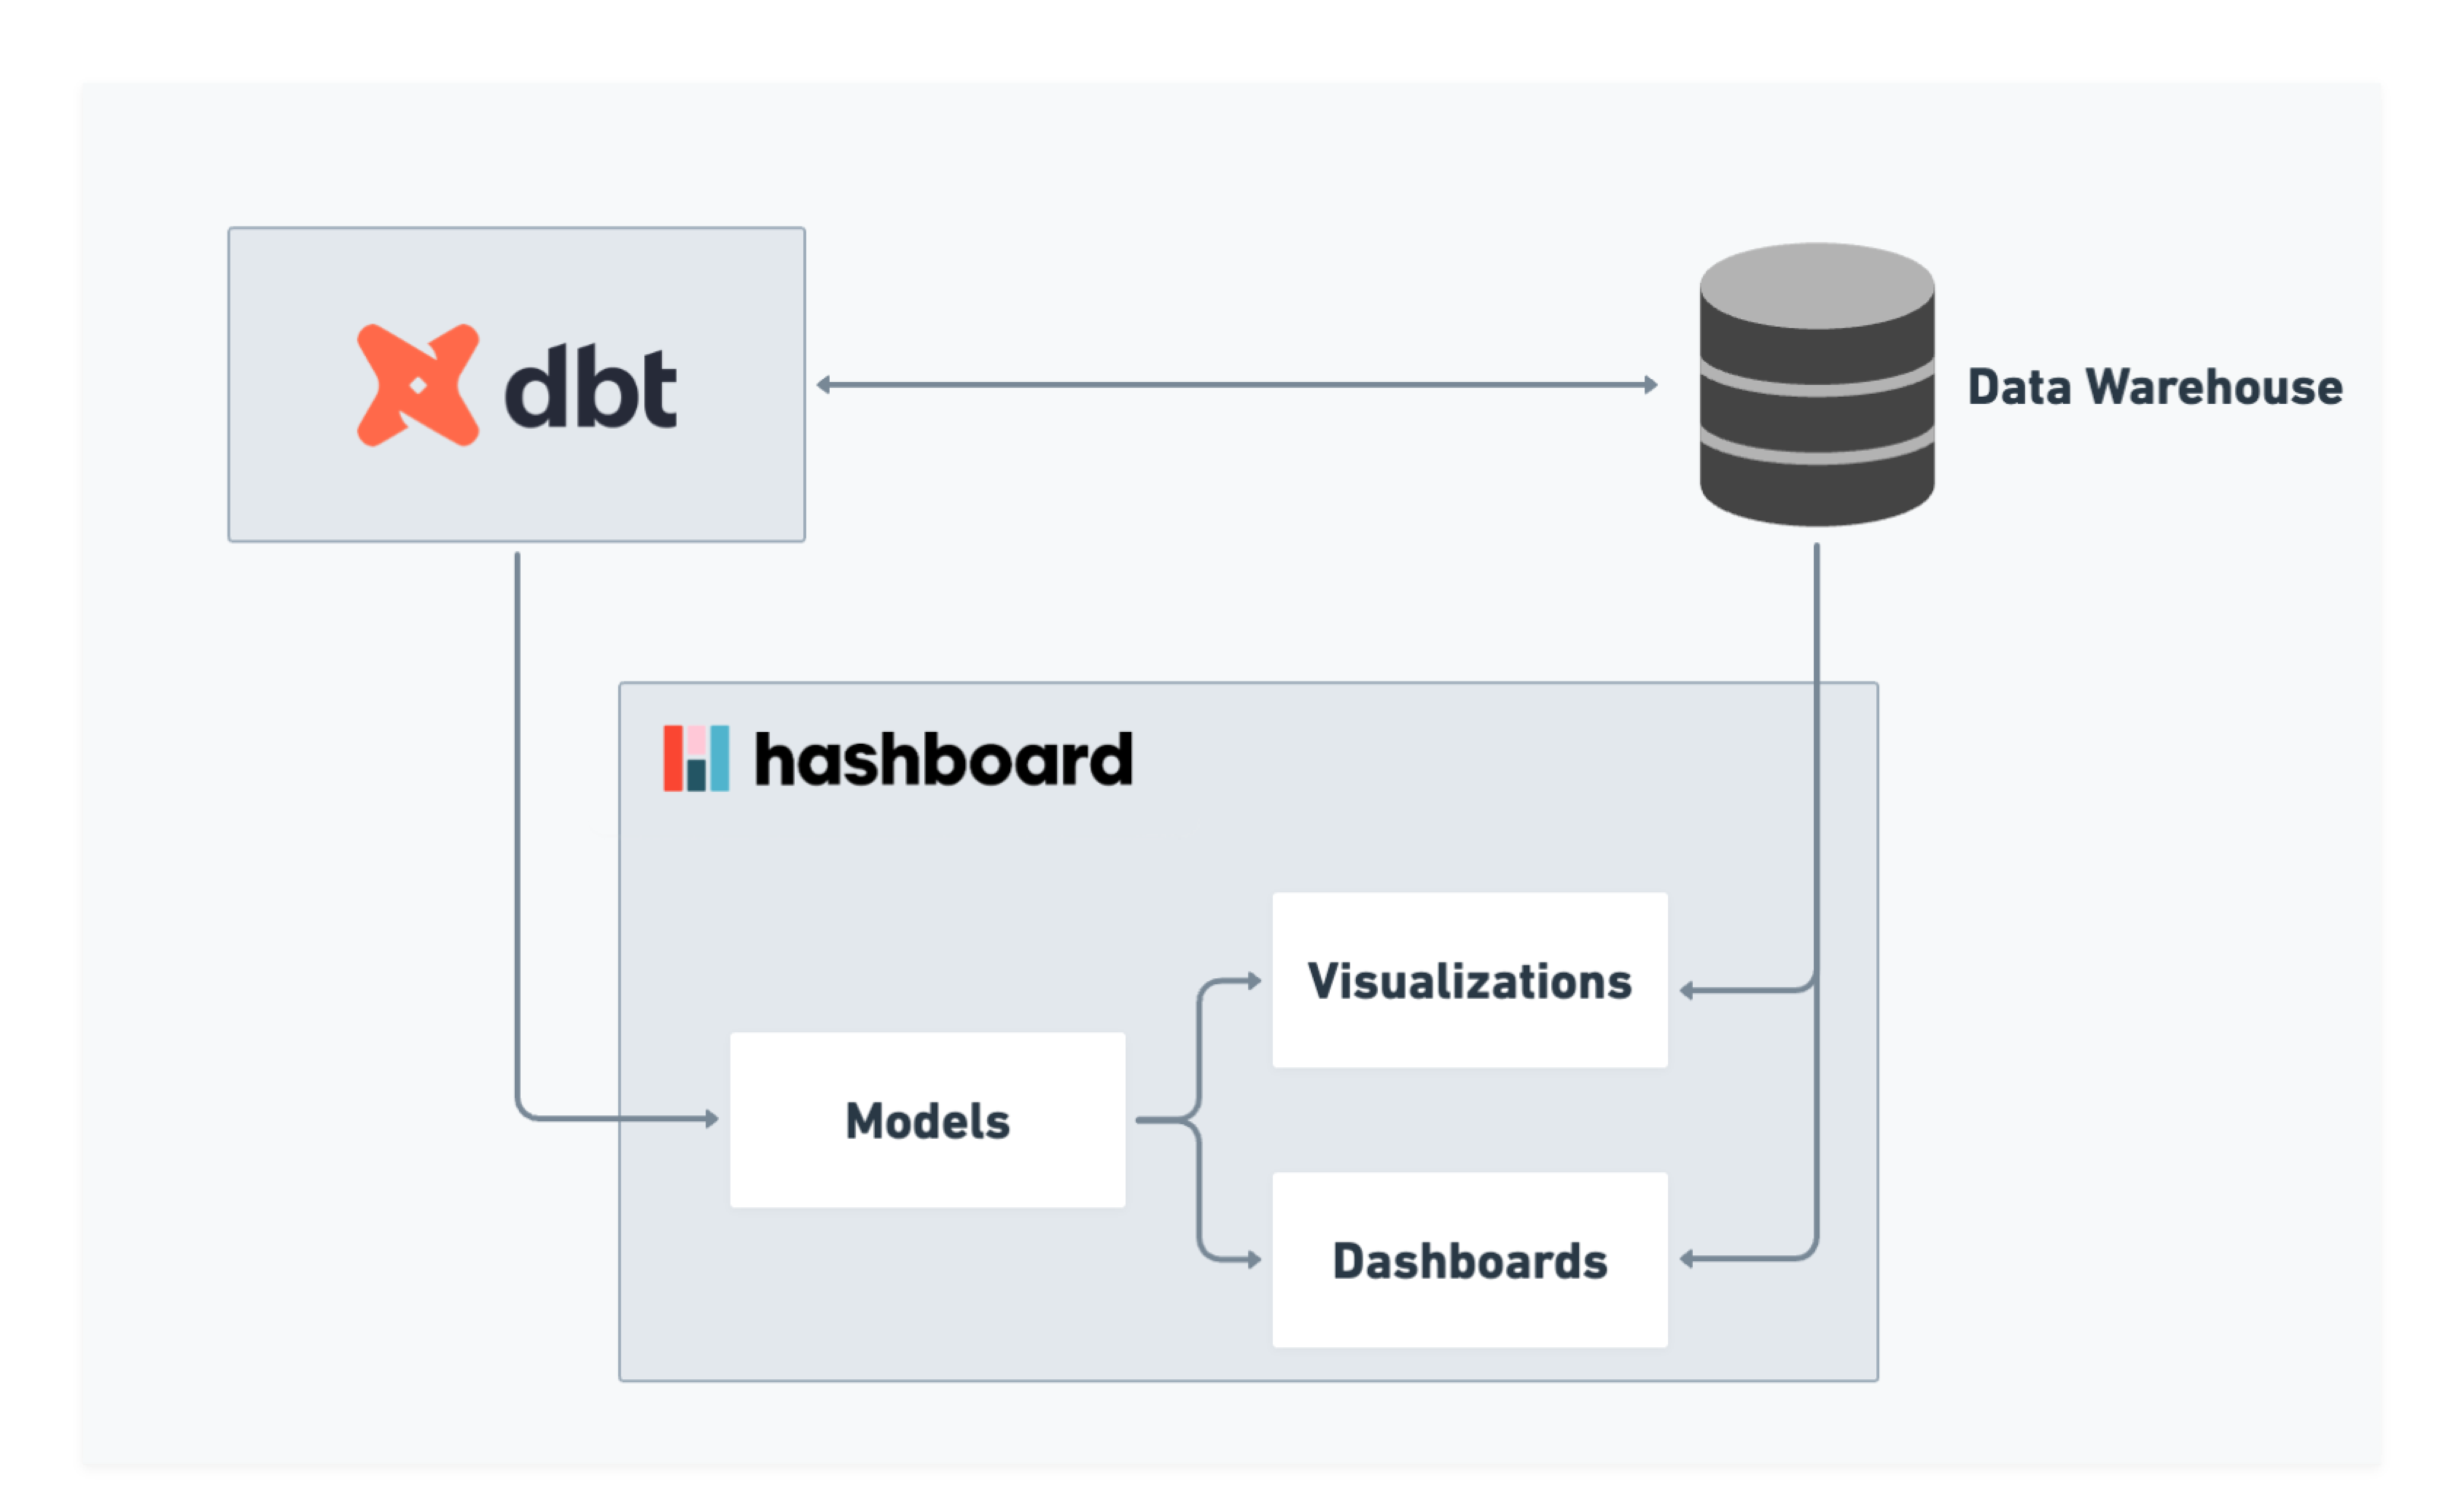
How does dbt work with Hashboard?
Hashboard directly imports models from dbt by specifying measures in dbt yaml files. Hashboard automatically syncs dbt documentation and keep measures in sync with downstream dashboards (whether they are checked into version control or not).
Bonus: our dbt integration can also be integrated in CI/CD workflows!
Our team practices what we preach and use dbt internally in conjunction with our internal analytics in Hashboard. We even use dbt in conjunction with GitHub actions to save money on our BigQuery costs as outlined in this post!
Why consider using Hashboard with dbt?
Hashboard provides flexibility for teams that are considering using dbt. While some BI tools rely solely on data to be transformed in dbt and imported into their tool, Hashboard offers a visual modeling layer that makes it possible to model data from major data warehouses and uploaded files via DuckDB. This flexibility prevents vendor lock in for our customers and doesn’t limit modeling capabilities based on dbt knowledge. Tables from dbt, Snowflake and Redshift can all live in harmony together in Hashboard.
If you’re interested in using CI/CD workflows in Hashboard, you can easily integrate dbt into those workflows to deploy updates to your project. This is super helpful for previewing builds and ensuring that changes aren’t breaking resources downstream.