Bar + Line Charts…and more!
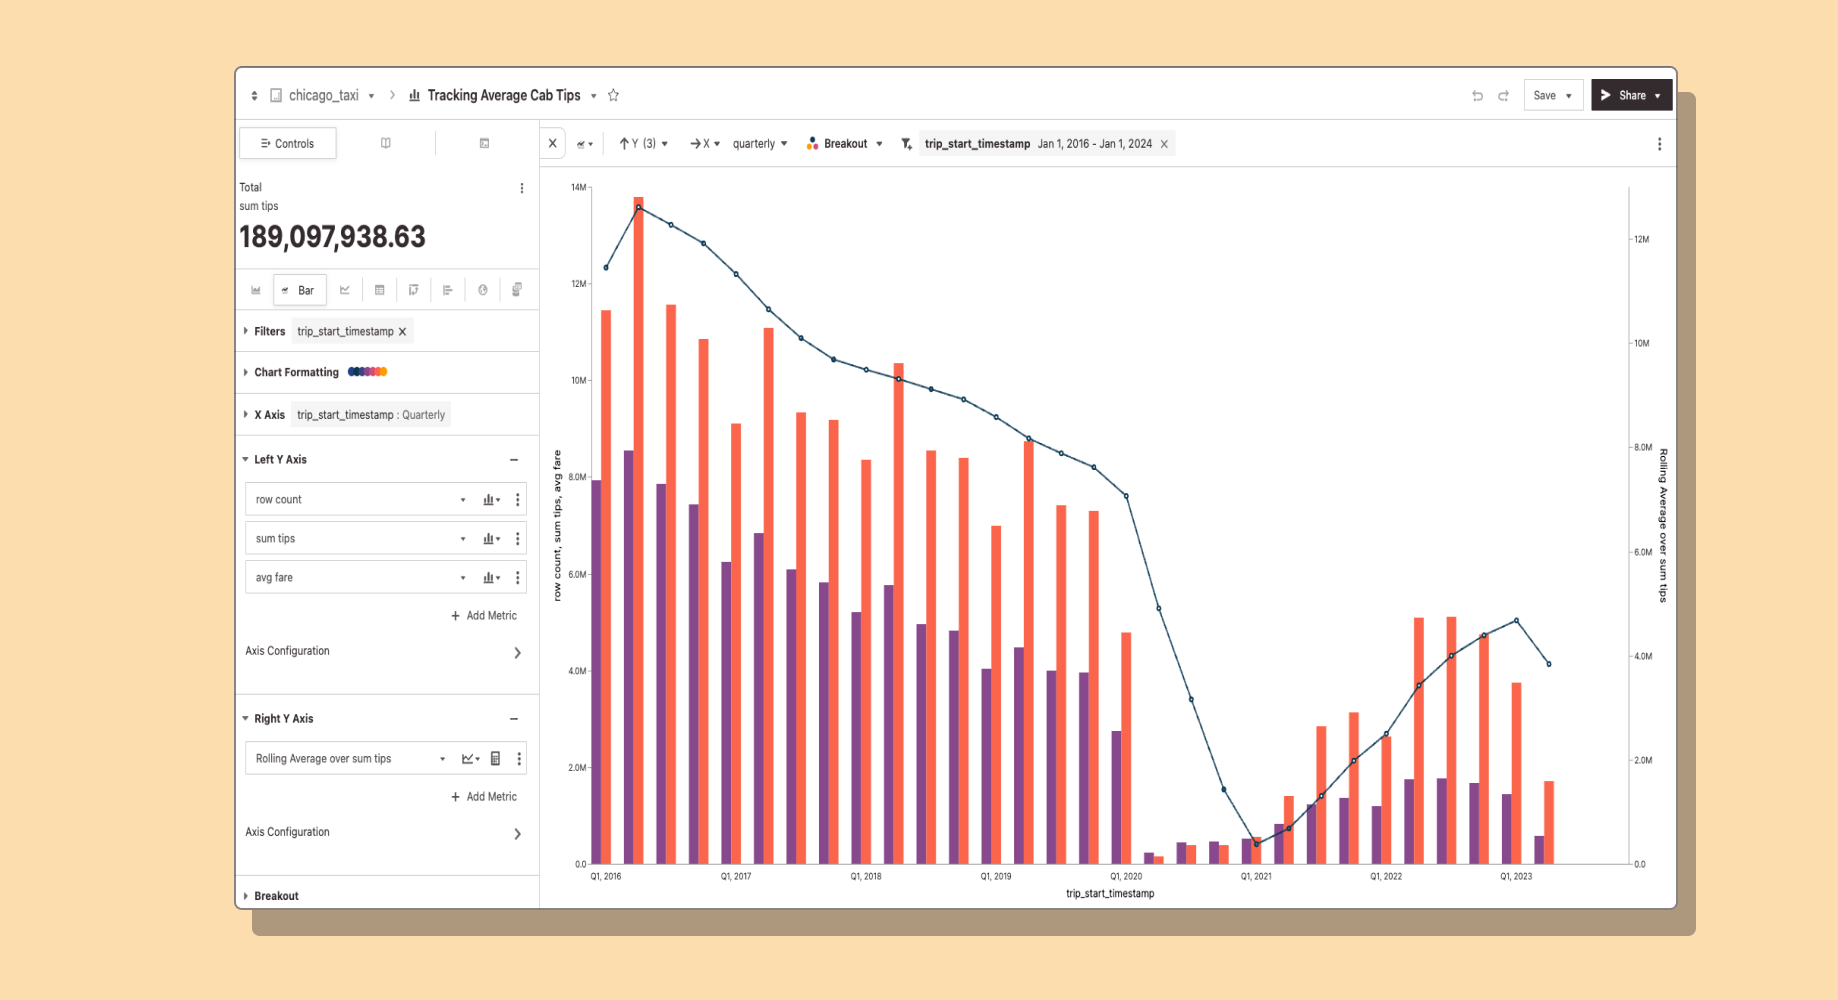
You’re now able to configure different mark types for each measure in Hashboard! Choose from bars, areas, and lines to layer on top of each other in the same chart. Mixing mark types can help easily visually distinguish different types of measures. For example, you can use bars for measures that represent quantities, and lines on the same chart to show trends over time.
There’s more! You can also display measures on different axes and scales. With this feature, you can easily compare different measures by adding a secondary y-axis into your views. This is particularly valuable when dealing with datasets that have significantly different ranges or units of measurement.
You can customize each y-axis by adjusting their scales and ranges individually in the lefthand Control Panel. Combine these two features for highly customized, powerful charts.