

Charts, dashboards, and other business intelligence assets are some of the highest leverage resources at a company. They provide visibility into the business, track goals, and identify issues that need to be solved.
If you own resources at this layer of the data stack, you’ll want to think about your version control strategy. Just like with any other important engineering system, it’s important to have a record of what changes are being applied to your BI layer, tracking what exactly changed, when it changed, and who made the change.
Your approach for tracking these changes will vary depending on the needs of your team and the capabilities of your BI tool. Here are some options.
Keep a changelog
The simplest way to track BI changes is to keep a log of what changes are made. At a minimum, this should include a timestamp, who made the change, and a short description of what changed.
This approach works for only the simplest of setups, where you have a small number of dashboards and a limited number of people who have the ability to make changes. Otherwise, you’ll have trouble keeping the changelog up to date. Once you’ve moved beyond a handful of charts or have important decisions that depend on your dashboards, it’s a good idea to start treating your BI like production by introducing some tooling.
Save immutable copies of each version
Save a copy whenever you make a change and store it somewhere. This is a bit old-fashioned but might be the only viable approach when using a desktop-based tool like Tableau. Make sure you have a clear naming pattern or you’ll end up with notoriously confusing files like okr_dashboard_v2_new_final. You’ll also want some sort of deployment strategy to ensure users are only using the most recent version.
This only works for resources that do not change often, and are not edited simultaneously by multiple people. Even then, the number of files will quickly become unwieldy – you don’t want to end up with different people looking at different versions of your dashboard, which can be worse than having no version control at all!
Use your BI tool’s built-in change history
Some BI tools natively track the changes of your resources, and it might be enough to just rely on these built-in features for simple version control. In Glean each resource has a change history showing who has recently made changes. Metabase and Sisense also have this feature, though Apache Superset / Preset and Microsoft Power BI do not.
The main downside to only relying on native change histories is that it doesn’t allow you to correlate BI changes with other changes happening upstream. Often, a dashboard is updated as a result of a schema change in the database that it reads from. If you want to track this relationship, you’ll end up needing a separate changelog again.
Use code to define and deploy your BI resources
The most thorough approach for version control is to use code that is committed to git, usually alongside your data pipeline code. This allows you to capture the full context and intent of your changes. There are a few different variants here.
In a mature BI setup, there are typically two different types of resources:
A small set of models that define core concepts and metric definitions
A larger set of views and dashboards that represent summaries and adhoc explorations on top of your models
Among these layers, models probably don’t change very frequently, but when they do, they typically have upstream dependencies, and changes here can have a large impact on downstream views. On the other hand, your dashboards are probably changing often as business users iterate on what’s useful.
A common approach we see among Glean users is to start by prototyping models in the web UI and then commit the configuration into git once they are stable, while leaving downstream dashboards and explorations to be managed via the UI. This usually strikes a good balance between keeping tight control over the foundational bits of logic in your reporting stack, while not requiring business users to deal with code workflows to make changes. With Looker, there’s no prototyping phase – your model needs to be written in LookML to start, so version controlling it just involves checking that code into git.
Once particular dashboards become more mature, you can incrementally migrate these into code over time, although not all BI tools support defining visualizations themselves as code. The tooling will also have a big impact on how easy it is to define and deploy visualizations with a code-based workflow. The best workflows will have a very tight feedback loop between the code and the visualization – an inline editor in the browser helps a lot.
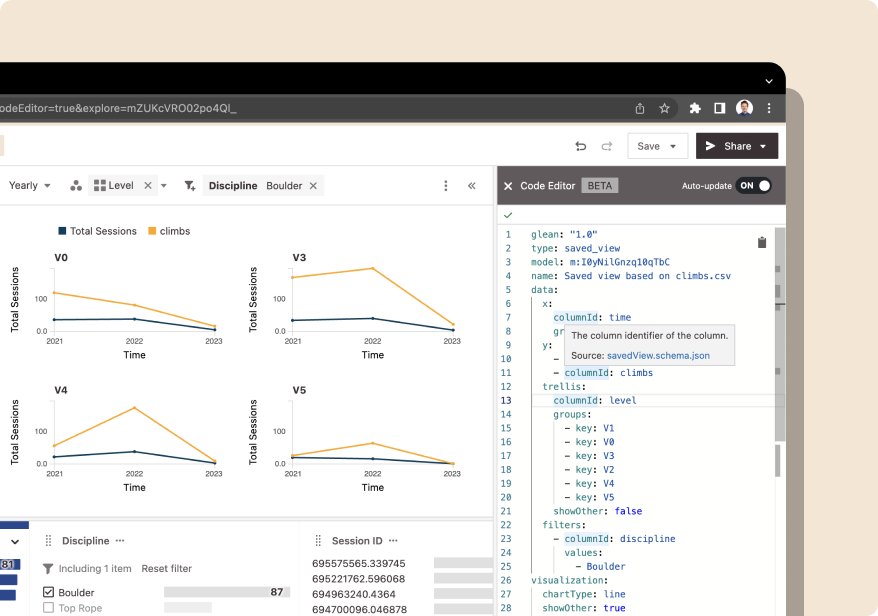
Glean’s web-based code editor and CLI workflows help to shorten the iteration cycle when developing BI as code.
It’s surprisingly common to not have any version control for BI assets. If you don’t have it, it’s a good idea to get it in place sooner rather than later. This post covers the basics; in future posts we’ll do some deep dives into some of these techniques.